ECG
Project Objective
An electrocardiogram (ECG) is a graph of voltage versus time of the electrical activity of the heart using electrodes placed on the skin, and is a tracing of the electrical activity that is taking place within the heart. Its amplitude is below 5 mV, and its frequency ranges from 0.05 to 100Hz.
In this project, I developed a wearable device to collect ECG data with a sampling frequency of 500Hz and high sampling accuracy.
System Architecture
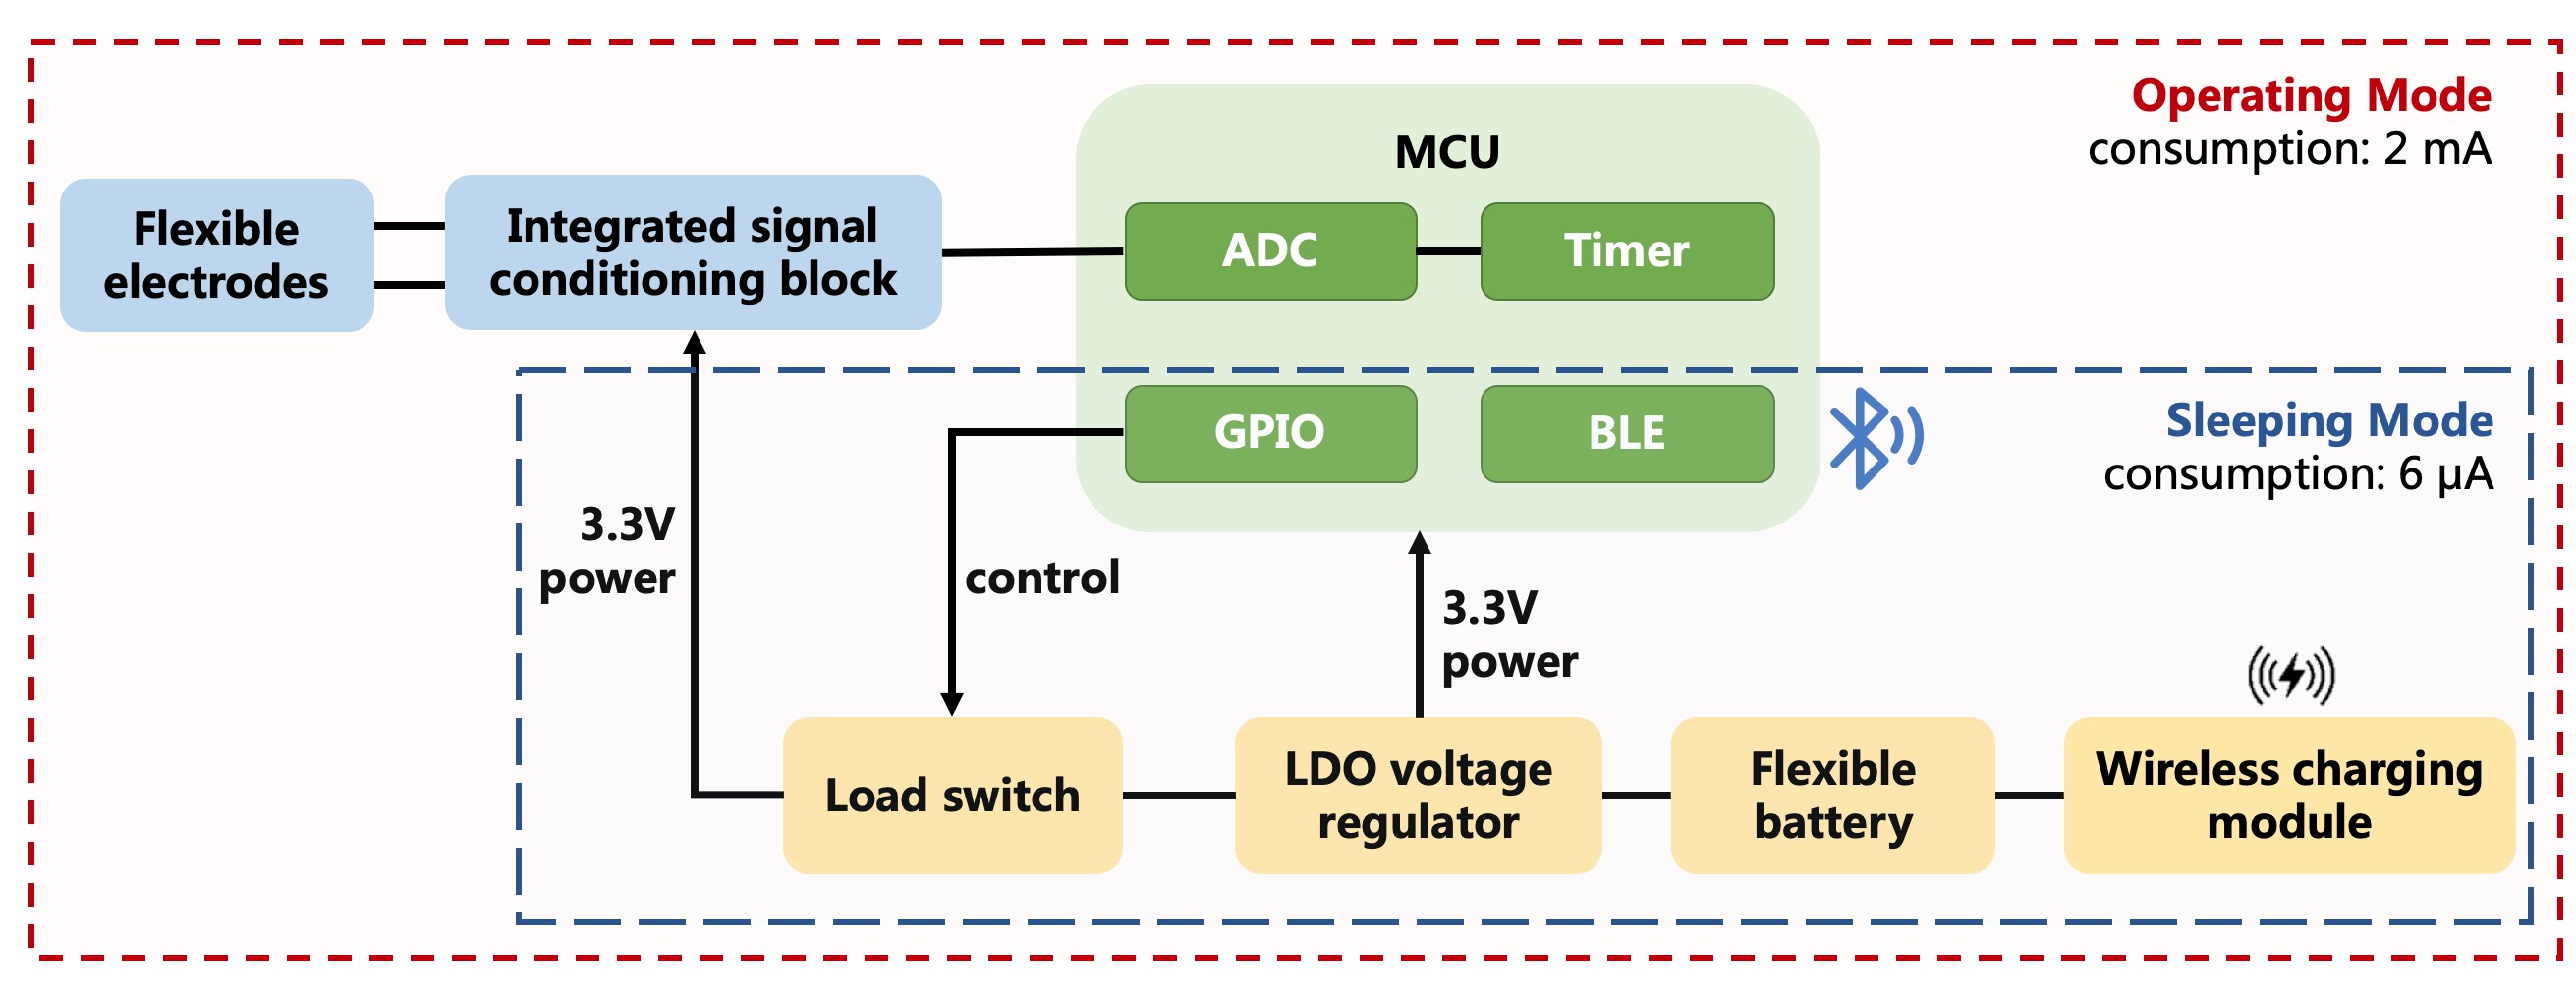
The wearable ECG device mainly includes 3 modules, as shown in Fig. 2
- Signal preprocessing module to filter and amplify analog signal.
- MCU module to control the operation flow and transmit BLE signal.
- Power management module to regulate the voltage, control the power consumption and support wireless charging.
 Fig. 2 System architecture. The blue part represents signal preprocessing module; The green part represents MCU module; The yellow part represents power management module.
PC and mobile phone are both available to receive and display the ECG signal, as shown in Fig. 3
 Fig. 3 The receiving terminal can be either a computer or a mobile phone
Hardware
- Use AD8232 to filter the analog signal and amplify the analog signal 100 times.
- nRF52832 MCU
- Use the ‘successive-approximation ADC’ to convert analog data with 12-bit resolution (0.878 mV).
- Set the timer and trigger event to sample per 2 ms.
- Declare service, characteristic and handles. Every time after sampling 10 times, encapsulate a BLE packet and update the characteristic value to transmit ECG data to the master.
- Sleeping mode: Set BLE slave’s advertising interval 5 s and disable all peripheral functions to decrease power consumption, and the current consumption is about 6 μA.
- Operating mode: When the BLE slave is scanned and connected by a master, pull up the GPIO which controls the load switch, then the load circuit can be powered. Also enable ADC and timer, then start to collect and transmit data. The current consumption is about 2 mA.
- Power Management
- Use TPS7A022 to regulate voltage to 3.3 V
- Use TPS22919DCKR as load switch to control the power supply for load circuit.
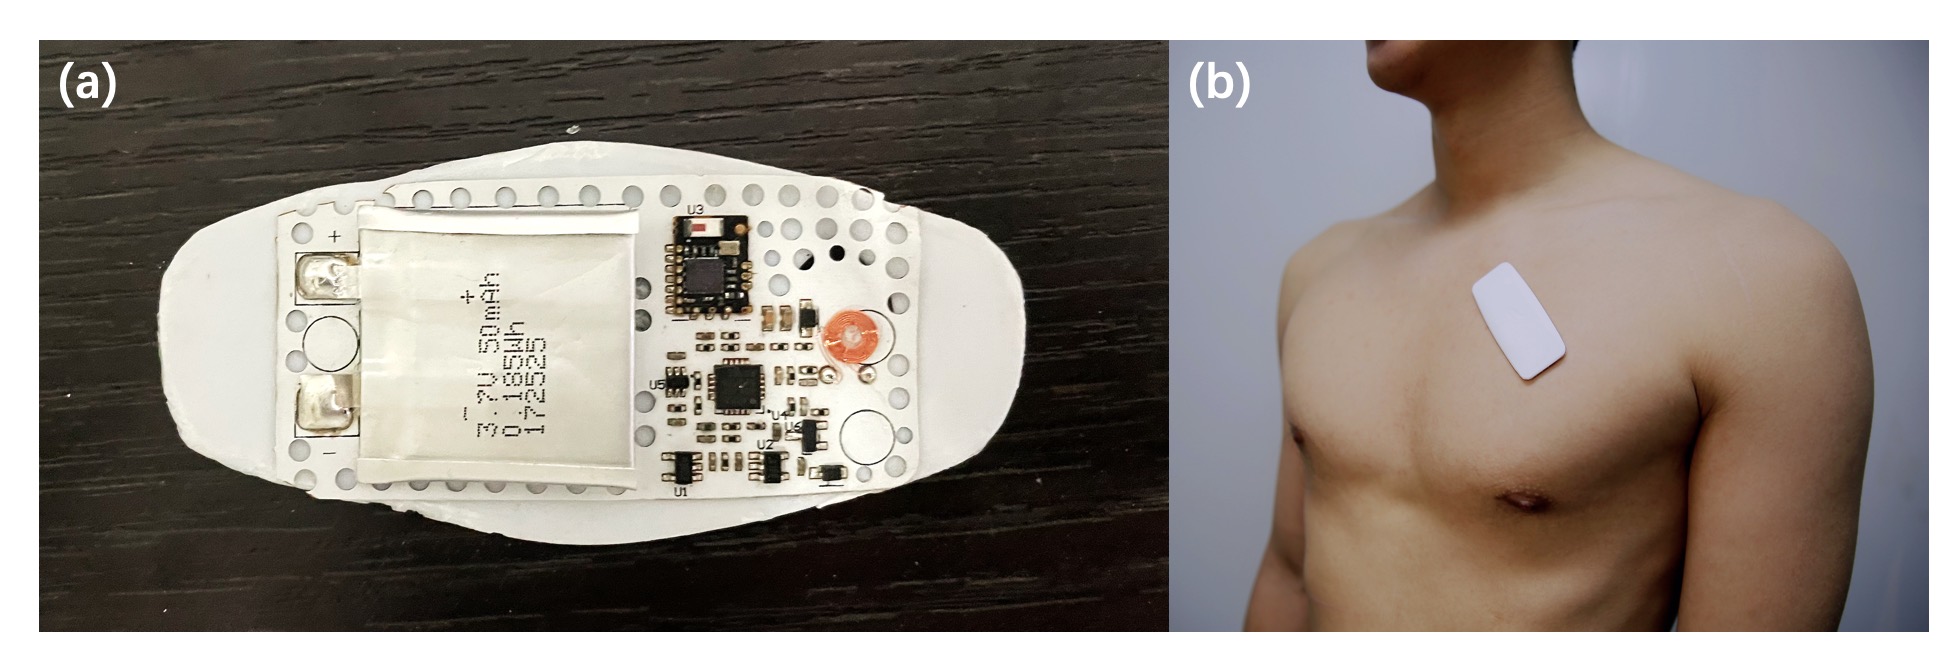
 Fig. 4 (a) Wearable ECG product; (b) Wearing effect
Software
I use python, C# and Java to develop desktop and mobile applications which implement multi BLE connections, data visualization, data analyzing and local storage.
The main design mainly consists of 6 modules:
- init: render page, initialize components, and register multi threads.
- process_input_data: receive data from serial port or Bluetooth, filter the data using FIR filter, and push data into local storage file and thread-safe queues. (Work as a producer thread)
- update_graph: pull data from a thread-safe queue and update the curves on graph. (Work as a consumer thread)
- extract_feature: pull data from a thread-safe queue, detect R wave, calculate the real-time R-R interval and heart rate (HR).
- monitor_flow: monitor the Bluetooth reception rate.
- del: free threads and resources.
Relevant Achievement
[1] Rongzan Lin, Yuanlong Li, Xinxin Mao, Wanting Zhou, Ran Liu*. Hybrid 3D Printing All-in-One Heterogenous Rigidity Assemblies for Soft Electronics. Advanced Materials Technologies, 2019, 4 (12), 1900614.
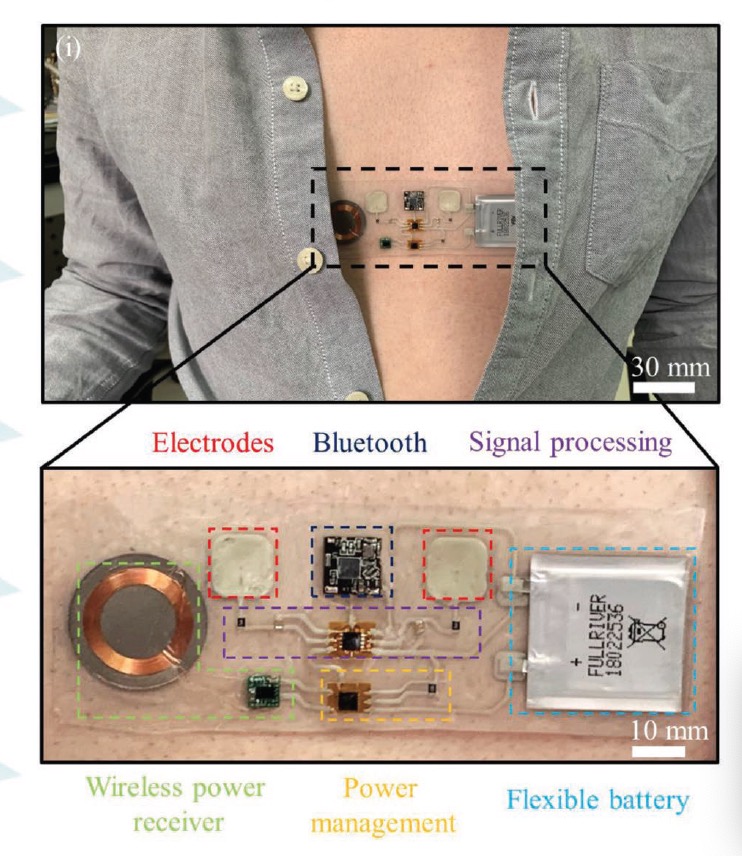
 Fig. 5 The wearable ECG device featured in our collaborative article, for which I was responsible for hardware programming and BLE data transmission.
